
inside agent autopsy: from raw traces to failure diagnosis

A service outage should have produced one clear failure. Instead, this agent turned it into a broken trajectory.
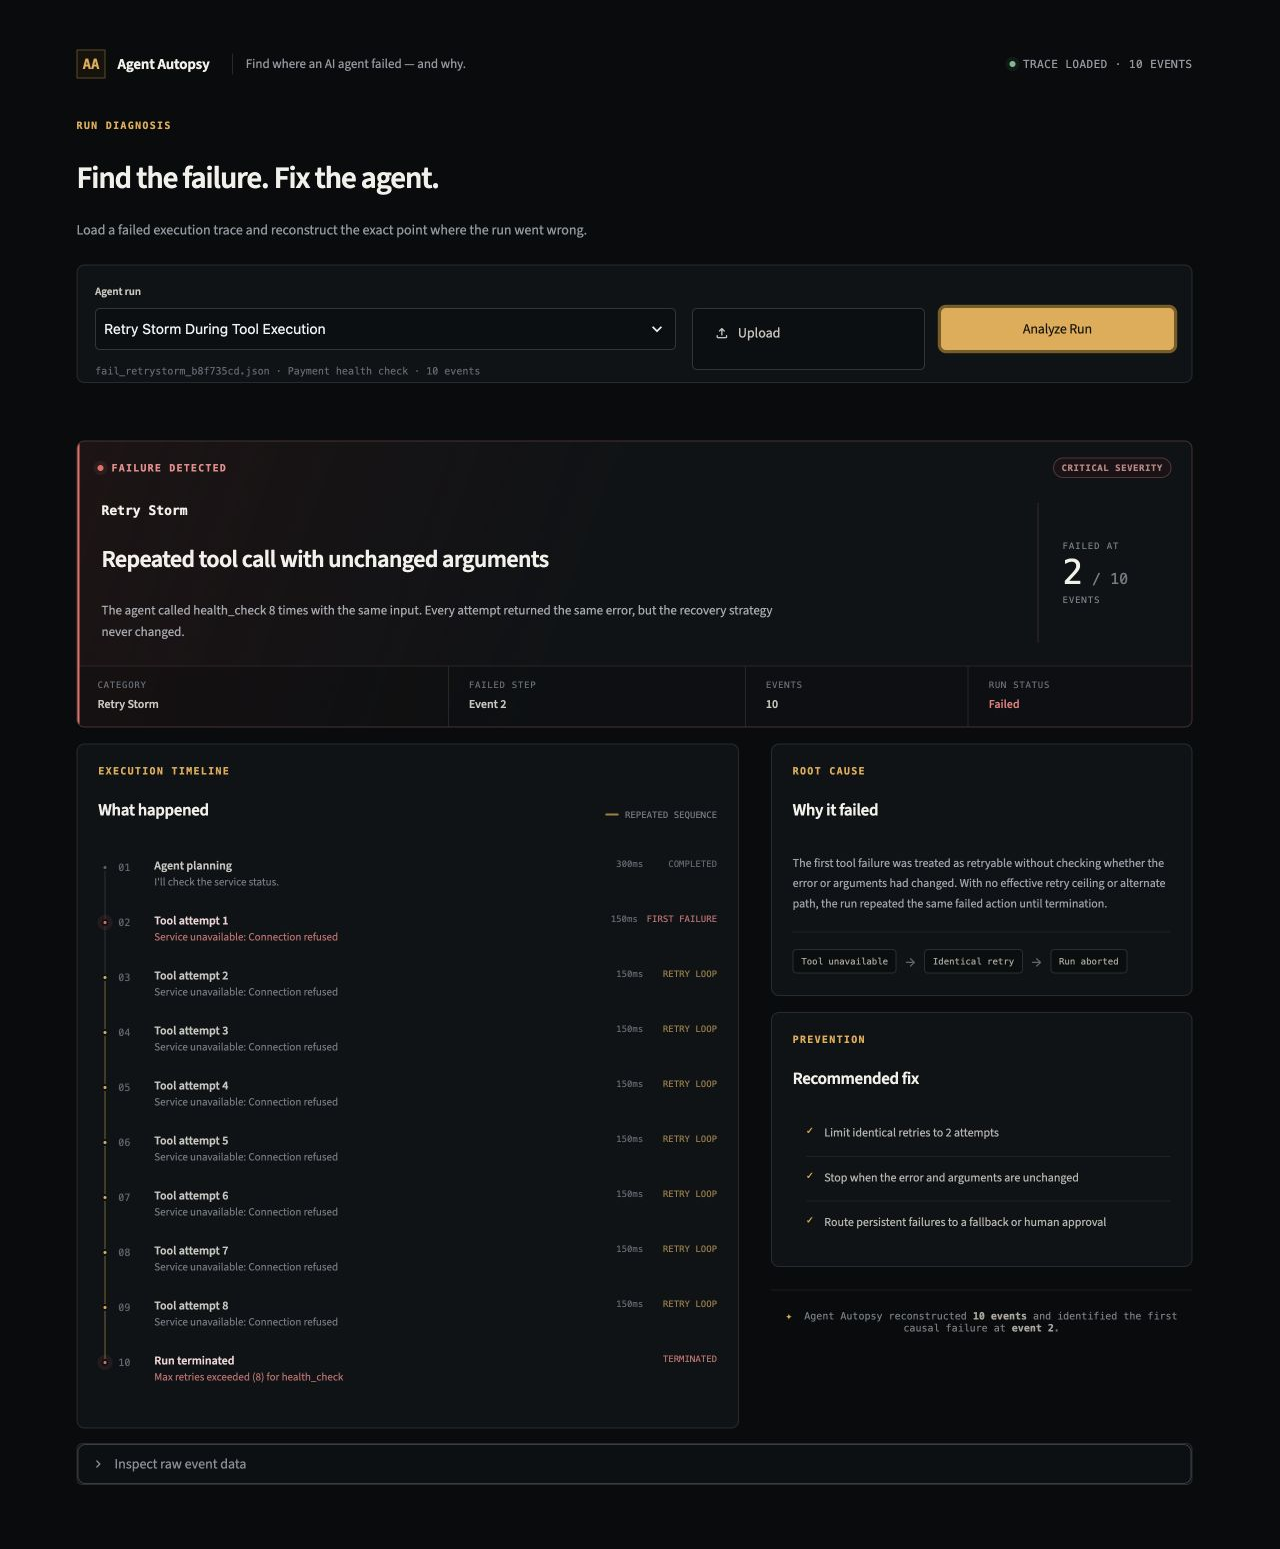
The job was small: check the payment service. Event 0 makes the plan. Event 1 calls health_check and gets Service unavailable: Connection refused. The agent repeats the same call seven more times with the same arguments and the same result. Event 9 finally stops the run. Nothing changed except the retry count.
The trace recorded all of that, but a list of events is not an explanation. Agent Autopsy reads the trace and names the roles: the first error is the trigger, the unchanged retries are the behavior that did the damage, and the final retry error is only the symptom. Every claim in the report points back to specific events. The default path is deterministic and local; an LLM is optional.
The basic idea
Agent Autopsy treats diagnosis as a chain. Framework-specific logs become a stable timeline. The timeline is scanned for structural failures, each failure is linked to the events that prove it, and that evidence becomes a likely cause and a suggested fix.

How the system is designed
Ingestion starts with format detection. The current adapters handle generic JSON, LangGraph, LangChain, and OpenTelemetry, with plugin parsers checked first. They map their source fields into Pydantic models for Trace, TraceEvent, environment data, task context, and aggregate statistics.
Normalization is deliberately small. It preserves the order produced by the parser, renumbers events sequentially, remaps parent references, fills missing timestamps from the previous known time, and recalculates tokens, latency, call counts, and error counts. It does not sort a questionable trace by timestamp and silently invent a new execution order. Stable IDs matter because every later claim points back to an event.
The deterministic layer currently runs 13 built-in detectors. They cover identical loops, time-window retry storms, redundant calls, empty outputs, error cascades, hallucinated tools, repeated authentication failures, timeouts, goal drift, stale context, token waste, inter-agent propagation, and context overflow. Contract validation is a separate pass for tool allow-lists, names, input and output shapes, and metadata.
That separation was useful. A structural failure such as three identical tool signatures doesn't need an LLM to weigh in; a reproducible rule and inspectable evidence are enough. It also means the analyzer can run offline and behave consistently in a terminal or CI job.
RootCauseBuilder converts detector results and contract violations into signals, then maps them to hypothesis templates. Hypotheses have fixed confidence values and are sorted by confidence. The report generator builds a timeline, evidence set, likely causes, health score, and categorized fixes. These confidences are prioritization hints, not calibrated probabilities.
The optional LLM path receives the normalized trace and deterministic pre-analysis. It can query events, synthesize a richer narrative, and validate citations and a structured JSON appendix. If credentials are absent or the call fails, the system falls back to deterministic analysis. Diagnosis stays separate from presentation, so the same result can appear as Markdown, JSON, CLI output, Streamlit panels, or MCP data.
One run, step by step
The bundled trace tells a simple story. One health_check returns a connection-refused error. Instead of changing its plan, the agent repeats exactly the same request, {"service": "payment-service", "timeout": 1000}, until the retry policy stops it at eight attempts. The outage is the trigger. Repetition without a new decision is the failure.

The identical-call detector uses a default threshold of three consecutive tool signatures. Structurally, that threshold is reached at event 3. Because analysis happens after the run, the detector scans the completed sequence and reports infinite_loop, critical severity, across events 1 through 8. The retry-storm detector does not emit a duplicate finding when those events are already owned by the identical loop. The same run also produces an error_cascade finding across events 1 through 9 and an empty_response finding for the eight failed tool calls, which have errors but no output value.
The deterministic report ranks “Missing exit condition in graph/router logic” first at its fixed 85 percent confidence, gives the run a health score of 34 out of 100, and recommends iteration guards, an exit condition, early loop termination, and localized error handling. The autopsy fixes command goes one step further and emits a patch snippet: a max-iteration guard named after the actual looping tool, health_check, plus an error boundary wrapper for the cascading failure.
The Streamlit UI runs the same parser and pre-analysis functions as the CLI, so what the demo shows is real analysis output.
What I tested
I ran the suite in the current repository: 120 tests passed in about 14 seconds, with one dependency deprecation warning. There is no lint or type-check step configured; CI runs pytest plus a detector corpus evaluation.
I also ran deterministic detection over all 21 JSON traces in the labeled corpus. All 21 analyses completed and produced 37 detector signals in total, matching the expected-pattern manifest for every trace, including the four clean traces that are expected to produce nothing. The three public example traces produced seven signals. The corpus evaluator that runs in CI checks precision and recall against that manifest.
Those numbers show the detectors still match their own baseline, and no more than that. The manifest records the detector baseline, the traces are script-generated scenarios rather than an independently labeled external dataset, and the retry-storm detector itself has no dedicated unit test yet: in the bundled retry trace, the stricter identical-loop rule claims those events first. I did not test live provider calls in this pass.
What it can and cannot do today
Today the project supports a Python API, a broad CLI, a multi-page Streamlit interface, and an MCP server. Trace-capture callbacks can write LangChain and LangGraph-style runs, while directory monitoring analyzes new files.
The limits are just as easy to state. The tool diagnoses a run after it ends; it doesn't intervene while the agent is executing. Detectors are heuristics and can flag legitimate polling or intentional repetition. Hallucinated-tool detection needs a complete tool allow-list. Goal drift is lexical when embeddings are disabled or unavailable, and semantic mistakes can still look structurally valid. Recommendations and confidence values are pattern templates. The system can identify strong evidence around a failure, but it does not prove counterfactual causality.
What comes next
The next technical question is how much of this evidence can move into the execution loop. The same signatures used after a run could support duplicate-action guards, retry ceilings, exponential backoff, token and latency budgets, circuit breakers, tool permission checks, and approval gates. That work should keep the current property that makes the tool useful: every intervention must be explainable from the trace evidence that triggered it.
Collecting every event is not the same as explaining a failed run. A useful debugger has to connect the trigger, the agent's response, the repeated behavior, and the terminal symptom without hiding the underlying trace.